1. The target grade has no material file. For new grades, customized compounds and formulation changes, NPMATC can review existing supplier or customer data, identify missing rheological, PVT and thermal properties, and develop traceable parameters. A matching material name or similar MFR does not establish equivalence.
2. Existing data are incomplete. Single-point properties, partial curves or older files can be assessed for raw points, units, test conditions and model requirements. Define supplemental testing and fitting around filling, packing, cooling or warpage objectives, avoiding both unnecessary retesting and undisclosed substitution of generic data.
3. Simulation differs from actual molding. Investigate material data together with geometry, mesh, mold configuration, machine response and actual processing. Molding records and dimensional measurements support targeted testing, parameter review and comparisons. These are typical commissioning scenarios, not completed project cases. Testing, file creation and part analysis have distinct scopes.
4. Required material tests. Select tests according to material type, analysis objective, model and available data. Confirm methods, editions, equipment suitability and report scope in the project plan. Qualification marks depend on the current authorized scope and commissioned method.
Property |
Equipment / data |
Reference |
MFR / MVR |
Melt flow rate instrument |
ISO 1133-1:2022 |
Processing shear viscosity |
Capillary rheometer; multi-temperature curves |
ISO 11443:2021 |
Complex viscosity / viscoelasticity |
Rotational rheometer; complex viscosity, storage/loss moduli |
ISO 6721-10:2025 |
PVT |
PVT apparatus; pressure–specific volume–temperature curves |
ISO 17744:2025; ISO 17282 for design-data acquisition |
Specific heat / transitions |
DSC |
ISO 11357-4 and relevant parts |
Thermal conductivity |
Instrument matched to measurement principle |
Relevant ISO 22007 part |
Mechanical / thermal expansion |
Universal testing machine, suitable strain measurement, TMA |
ISO 527 series, ISO 11359-2 |
Molding / post-molding shrinkage |
Standard mold, injection machine, dimensional measurement |
ISO 294-4, GB/T 17037.4; not automatically specialized calibration |
5. Rheological parameters and equipment. Capillary rheometers characterize melt flow across temperatures and shear conditions, supporting filling-pressure assessment and viscosity-model fitting. Evaluate entrance pressure losses, non-Newtonian corrections, wall slip, shear heating and degradation as appropriate. Rotational rheometers measure complex viscosity, storage and loss moduli through suitable frequency, strain or time sweeps, adding low-shear, viscoelastic and stability information. Establish a suitable linear viscoelastic region. Complex viscosity must not be substituted directly for steady-shear viscosity without material-specific validation, particularly for highly filled, structured or reactive systems.
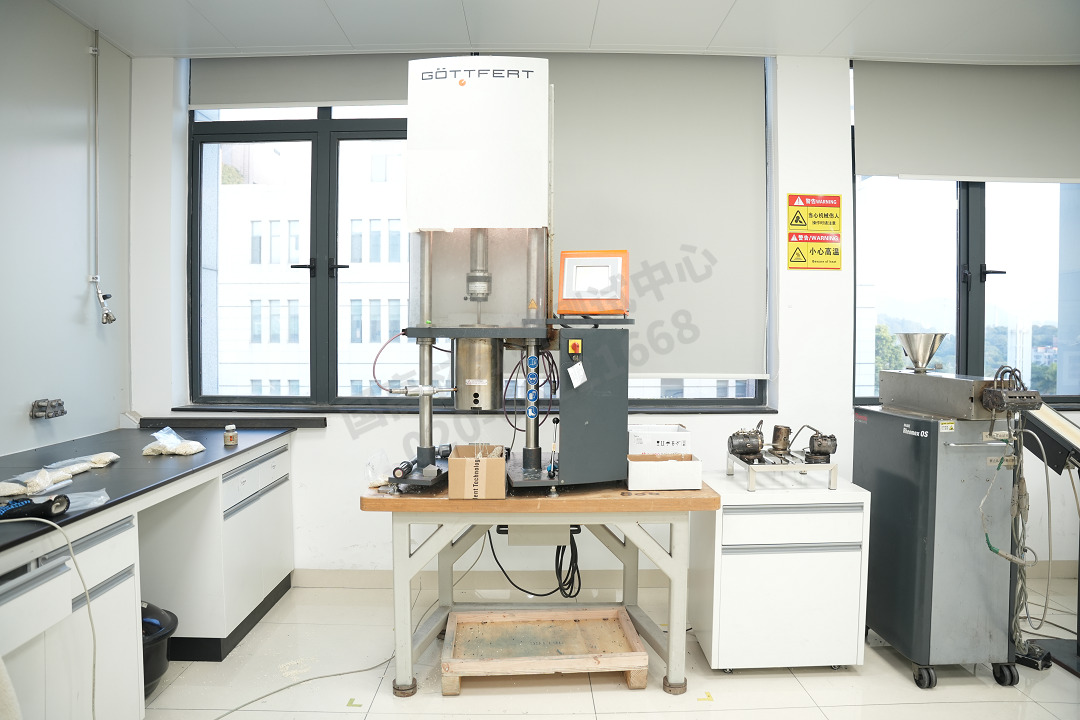
Figure 1 NPMATC high-pressure capillary rheometer
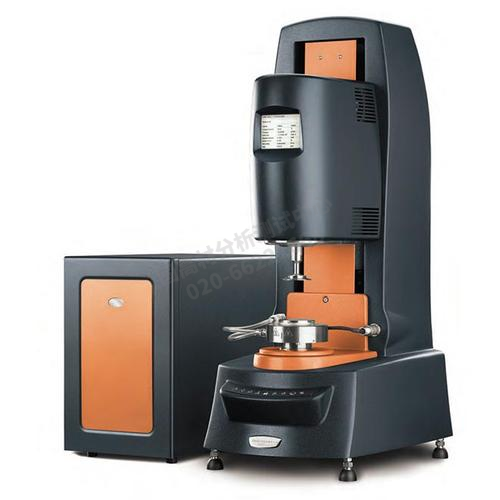
Figure 2 NPMATC rotational rheometer
6. PVT and volumetric response. PVT describes the pressure–specific volume–temperature relationship through melt and solid states. It supports packing compensation, volumetric shrinkage and related warpage inputs. Review temperature and pressure coverage, heating/cooling path, cooling rate, transition regions and repeatability. Measurements require suitable fitting and applicability checks before simulation use; raw PVT points are not a ready-to-use material file.
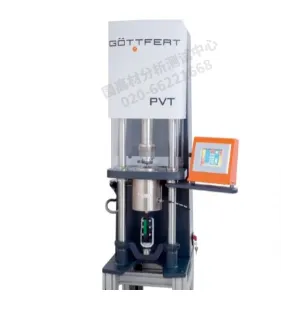
Figure 3 NPMATC PVT apparatus
7. Thermal and shrinkage-related measurements. Specific heat and thermal conductivity affect temperature fields and cooling calculations. Use appropriate ISO 11357-4 and ISO 22007 methods and document temperature, state and direction. Mechanical properties, thermal expansion and shrinkage may be added as required by the model, using ISO 527, ISO 11359-2, ISO 294-4 or GB/T 17037.4 as applicable. Maintain batch, direction, molding and measurement traceability. Specialized model calibration has additional requirements.
8. MFR versus viscosity curves. MFR is measured under a specified temperature and load and is useful for routine comparisons and quality control. It does not fully describe temperature, shear-rate or pressure dependence. Materials with equal MFR and similar composition may still differ in shear thinning and temperature sensitivity. Viscosity-based simulations use curves and model coefficients; changing an MFR display field alone does not recalibrate those models. Check the target environment. Compare curves over the actual processing range along with PVT, thermal and filler information. The illustration is conceptual, not measured data.
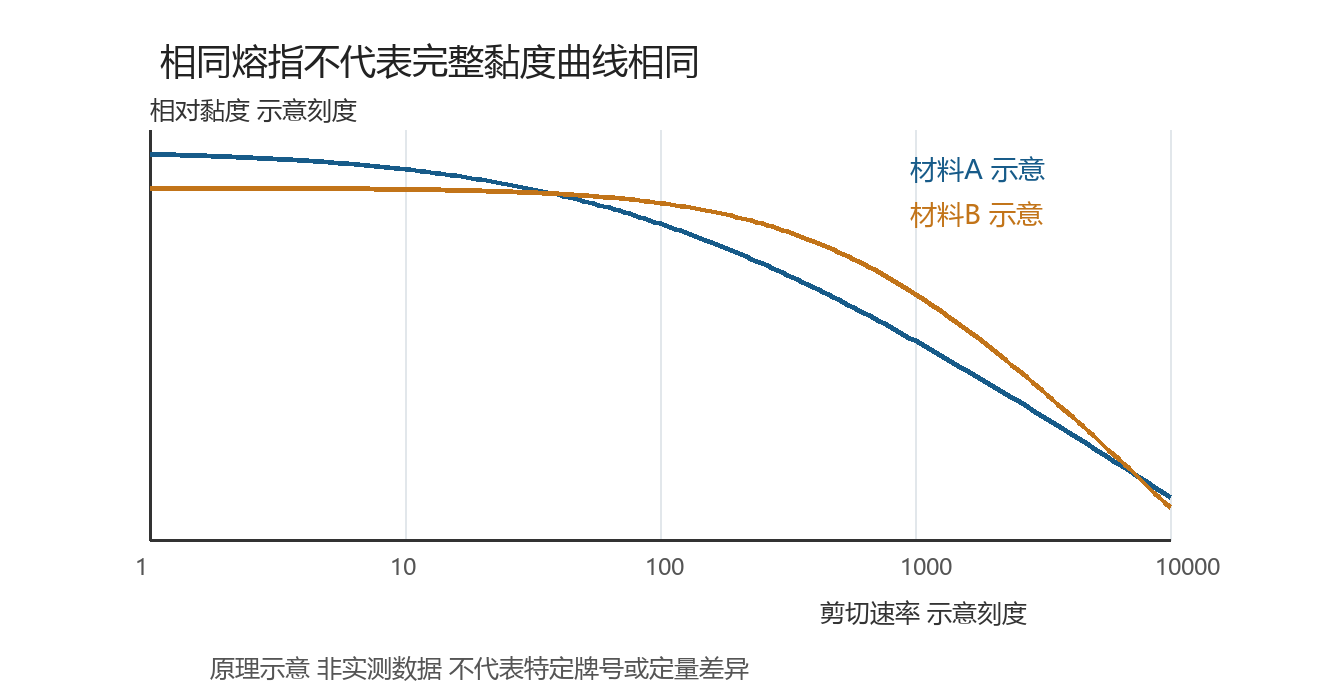
Figure 4 Equal-MFR viscosity curves: conceptual illustration, not measured data
9. UDB file service workflow. The workflow comprises existing-data assessment, supplemental testing, model fitting and file checks. Define the material, target environment and analysis tasks first; document sources, valid ranges and completed checks at delivery.
10. From measured curves to a readable database file. A UDB file stores material identity, properties and model parameters for a particular molding-analysis environment. It is not a universal exchange format for all software. Confirm version, material class, file type and supported analysis functions. A datasheet with single-point MFR, density or modulus cannot fully represent processing-dependent behavior.
11. What a UDB file contains. Typical groups include material identity and processing information, rheological models, PVT models, thermal properties and task-specific mechanical, expansion, shrinkage, crystallization or orientation data. Semi-crystalline, fiber-reinforced and reactive systems require separate assessment; no single checklist applies to every project.
12. Measured, estimated and fitted data. Measured data come from a specified sample and test. Estimated or referenced values come from experience or other sources. Fitted values are model representations of data. Identify each source separately. Good fit statistics do not prove accuracy outside the tested range. For demanding dimensional or cooling predictions, prioritize sensitive properties and suitable physical comparisons.
13. Why shrinkage tests may be used to correct residual-stress models. Nonuniform cooling, packing and orientation can create residual stresses that contribute to warpage after demolding. Applicability depends on material data, analysis dimension, mesh and model implementation. Some environments offer shrinkage-test-corrected residual in-mold stress models, also termed CRIMS. Experimental shrinkage data calibrate relevant model behavior; this is not a single datasheet shrinkage value or a direct measurement of all residual stresses. Missing correction coefficients do not automatically make a file unusable. Evaluate available models and validation needs rather than assuming a universal error percentage.
14. Datasheet shrinkage versus model-calibration data. TDS shrinkage reflects specified specimens, directions, conditions and measurement times. Calibration datasets must meet model-specific requirements for specimens, processing, thickness and fitting. The two are not interchangeable. Parallel and transverse shrinkage should not be averaged indiscriminately. Specialized calibration capability and compatibility require separate confirmation.
15. Applicability of data and models. Check grade, batch, sample state and coverage of processing temperatures, pressures and shear rates. Record model selection, corrections, fitting deviations and referenced values. Reliable material data are essential, while geometry, mesh, mold and process settings must also match the intended application.
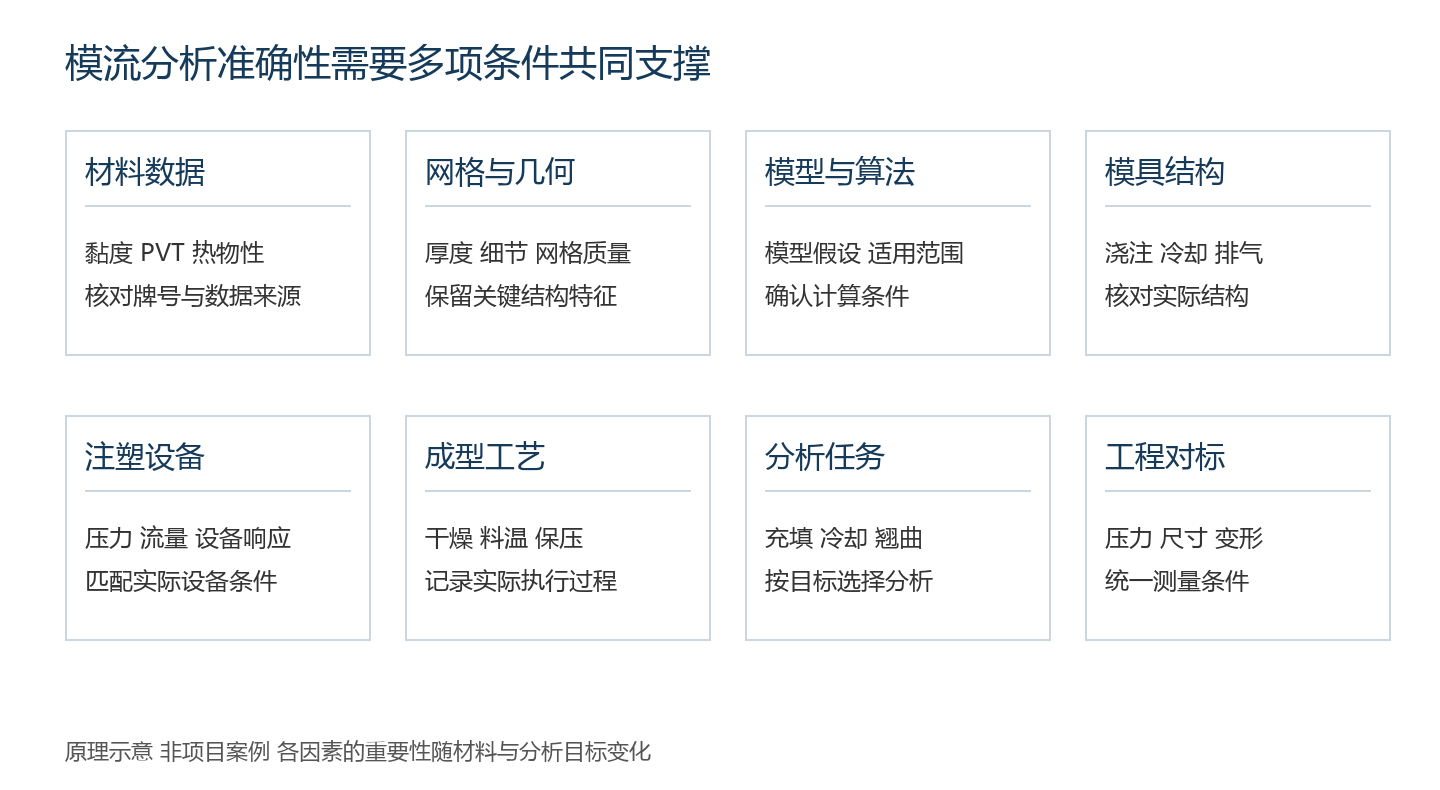
Figure 5 Factors affecting simulation accuracy: conceptual illustration
16. File checks and molding validation. Treat file readability, successful execution of a specified analysis and physical molding comparisons as separate acceptance levels. Readability does not prove all data were measured, and a completed calculation does not demonstrate part accuracy. Define reference frames, conditioning, measurement times and acceptance tolerances for dimensional validation.
Level |
Check |
Meaning |
Readability |
Import, identity, fields, curves and units |
Data can be read and mapped |
Specified analysis |
Run, warnings and result plausibility |
Usability for the selected task |
Physical comparison |
Pressure, dimensions or warpage under matched conditions |
Prediction performance within the validated conditions |
17. Interpreting simulation results. Interpret plots with locations, times, material assumptions and process conditions. Filling results show flow sequence and last-fill regions; pressure must be checked against machine capability and delivery-system losses; cooling requires actual temperature and cycle information; warpage needs consistent constraints and measurement references. Do not judge acceptance by plot color or universal pressure, temperature-difference or warpage thresholds. Weld and air-trap predictions identify risks, while strength, venting and appearance need verification. Moisture, volatiles, degradation, composition and mold surfaces may affect burns, silver streaks, fiber exposure and flow marks. Distinguish calculated findings, engineering interpretations and open validation items. Standard shrinkage comparisons may use ISO 294-4 or GB/T 17037.4; conditioning follows GB/T 2918, ISO 291 and applicable material requirements. Actual-part acceptance follows drawings and agreed specifications.
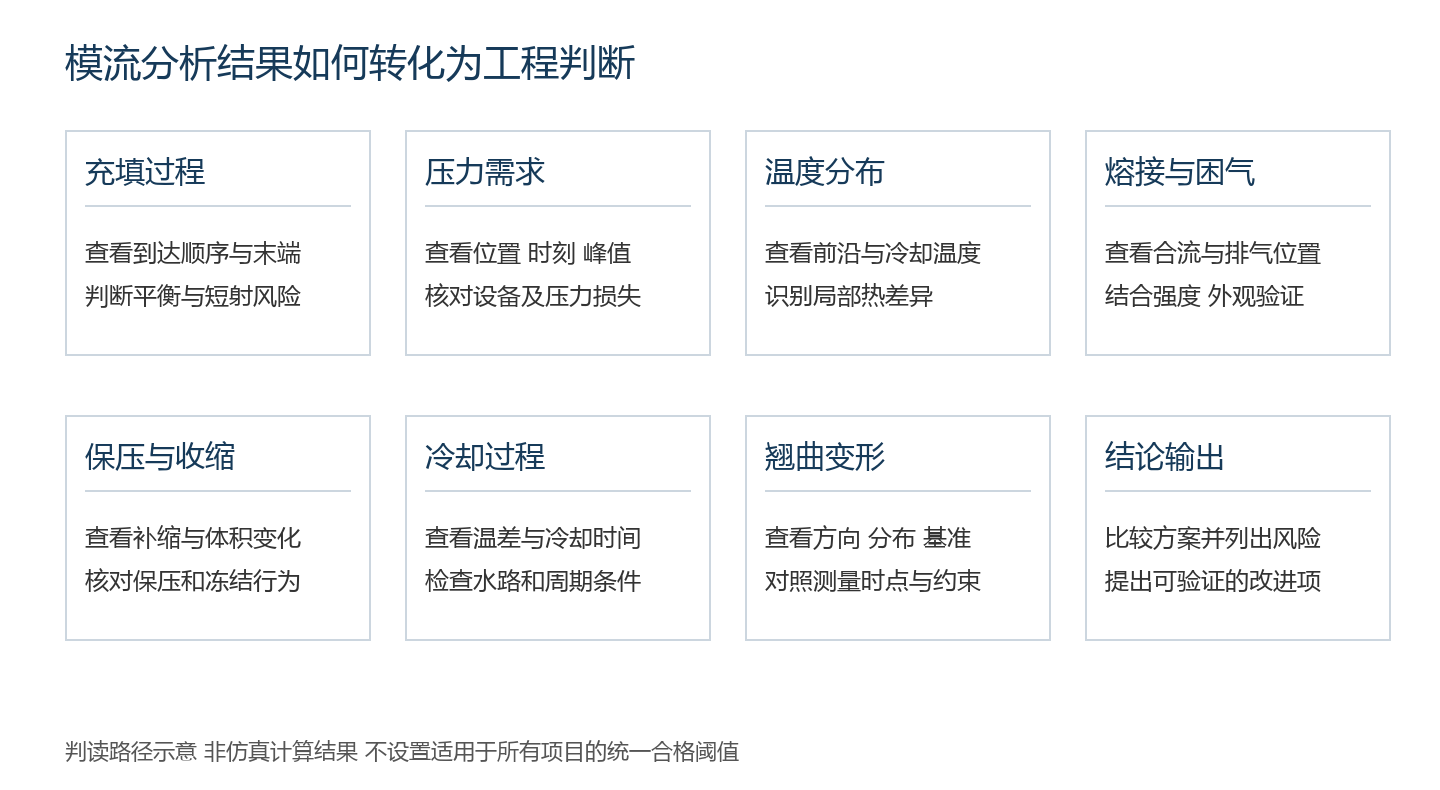
Figure 6 Result interpretation framework: conceptual illustration
18. Customer inputs and scope of work. Agree on inputs, work packages and deliverables before testing or analysis. Raw data, confidentiality, ownership and retention arrangements should be explicit. Part analysis and physical validation are separate work packages when requested.
Customer provides |
NPMATC work |
Agreed deliverables |
Material identity, batch, fillers and processing information |
Assess suitability and test matrix |
Scope and submission requirements |
Samples, existing data or historical files |
Supplemental measurements and source/condition checks |
Reports, points and curves |
Target environment/version and tasks |
Fitting, file preparation and checks |
UDB, fitting notes and check records |
Part/mold geometry, cooling/gating and machine settings |
Commissioned analysis and comparisons |
Results, risks and recommendations |
Molding records and measured dimensions/defects |
Agreed physical comparison |
Deviation assessment and next steps |
19. Sample submission and acceptance. Sample quantities and lead times depend on material, test matrix, repeats and validation needs. Existing-data fitting requires usable raw points and conditions. Reinforced, semi-crystalline or reactive materials may need additional directional, thermal-history or curing information. At acceptance, check version, material identity, data sources, models, units, ranges, reports and completed checks. Specialized calibration or public database submission requires separate confirmation.
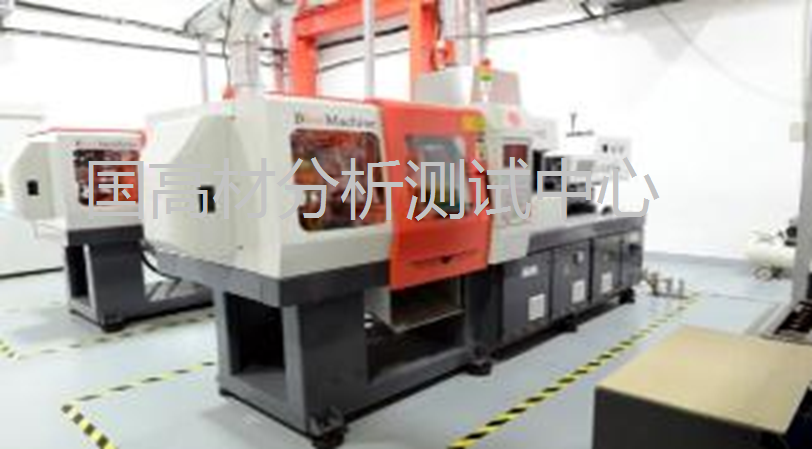
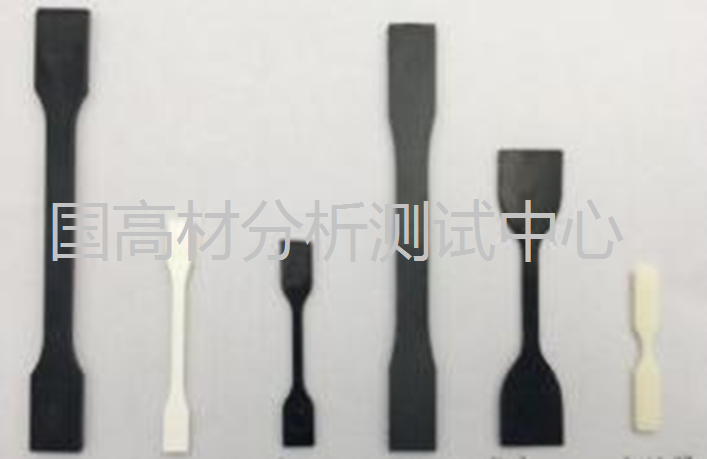
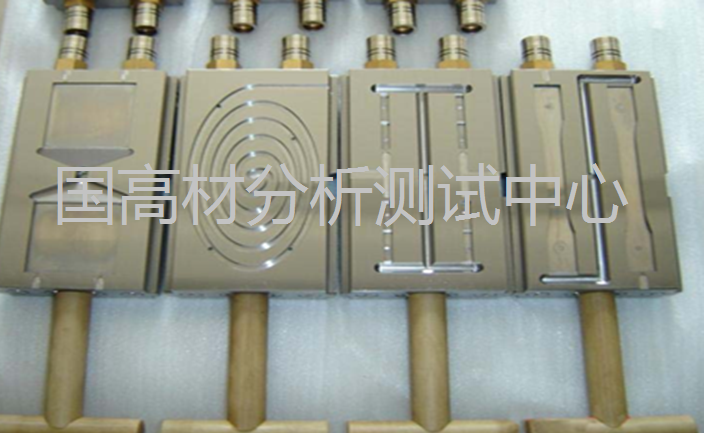
20. Consultation and supporting services. Submit the material information, existing data and engineering question through NPMATC official contact channels. Testing, fitting and validation are selected around the data gaps. Specimen preparation and spiral flow testing can connect material parameters to actual filling behavior.
21. Where are molding-parameter tests and UDB services available in Guangzhou?. NPMATC provides PVT, rheological and related thermal testing and UDB services in Guangzhou. Submit the grade, target environment and analysis objectives to confirm the tests, fitting scope and deliverables.
22. Can existing measurements be used for fitting only?. Existing-data assessment is available. Provide raw points, units, conditions, methods and sample information. If suitable, fitting and file checks can be discussed; gaps require supplemental measurements. Datasheets or curve images alone need further assessment.
23. Can materials with equal MFR share a UDB file?. Equal MFR does not establish equal viscosity curves, PVT, thermal properties or shrinkage. An equivalent material may support preliminary estimates if assumptions are stated, but formal applicability depends on data coverage, objectives and verification.
24. Can a file without shrinkage-correction data still be used?. This depends on the analysis and available model. Missing specialized calibration does not rule out every task. Document assumptions and missing inputs, then determine additional testing and comparison requirements.
25. What should be checked at delivery?. Check the commissioned reports and data, UDB file, model and source descriptions, valid ranges and completed file checks. Part-analysis or molding-comparison deliverables are accepted separately when included in the contract.
26. What should be checked first when results disagree with molding?. Verify material/file identity, then actual processing, geometry and mesh, cooling, machine conditions and measurement direction, reference frame and elapsed time. Investigate dominant deviations systematically before deciding on additional tests or process changes.
Technical reading (Chinese): Capillary rheometry; Rotational rheometry; PVT and molding processes;